An Introduction to Heart Rate Variability (HRV) Measurements
Welcome to my website. I started it to share my interest in health tech, wearables, and machine learning, and to write about topics I have read and researched that I find worth sharing. I will not suggest or recommend anything here. I will share my own interpretation and encourage you to form your own.
I will start my first few articles about one of the very popular health metrics - Heart Rate Variability or HRV since I have collected a decent amount of data and have wanted to write about this topic for a long time. I will cover this in a series of articles rather than cram everything into one.
What is Heart Rate Variability (HRV)?
Heart rate variability (HRV) is a measurement of the fluctuations in our heartbeat. These fluctuations exist because our heart doesn’t beat evenly, which is very common in a healthy heart. It’s also important to distinguish between HRV and Heart Rate. Heart Rate is measured by how many times the heart beats in a minute, such as 60 or 70 beats per minute. So, the unit of Heart Rate is beats per minute, or BPM. HRV measurements are more complex, and the unit depends on the type of measurement.
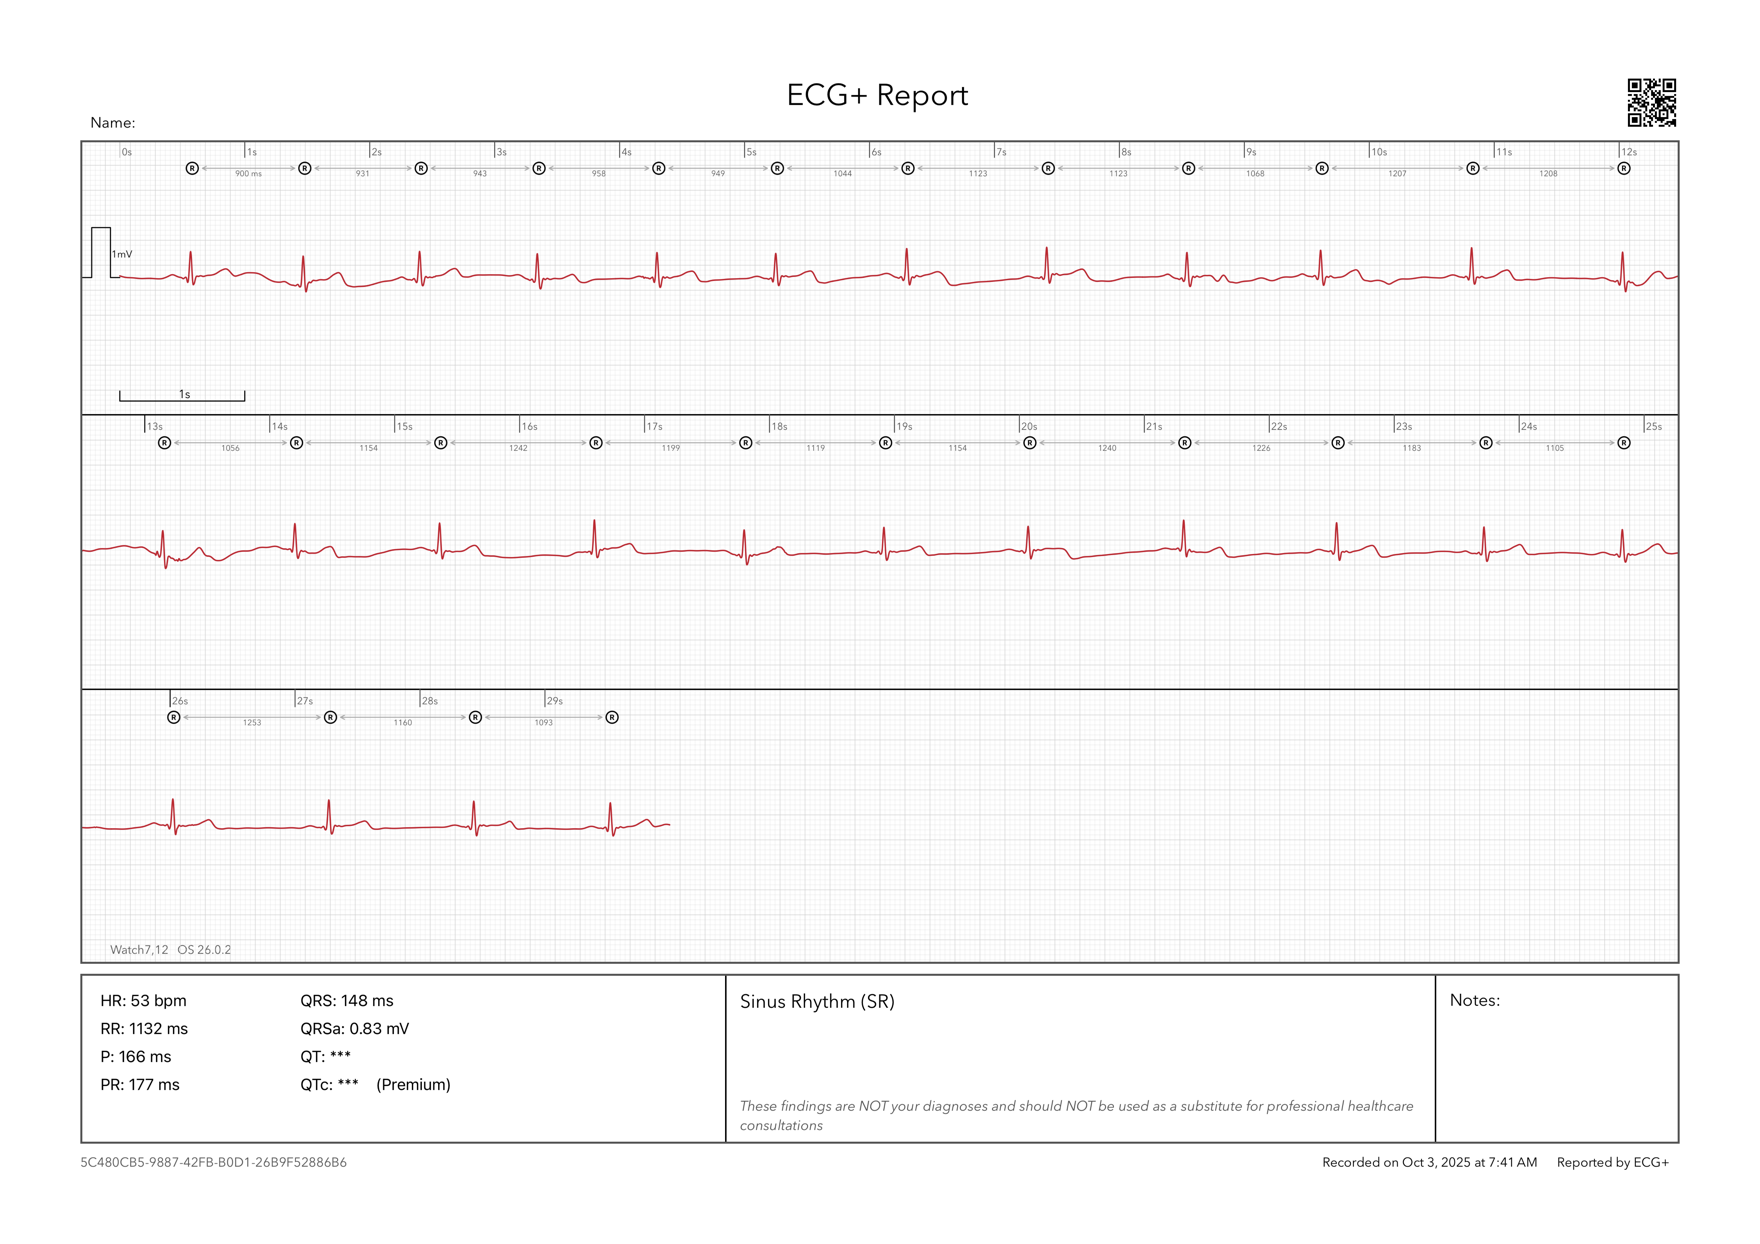
As you can see in the ECG diagram below, the time duration between each heartbeat varies, and those time intervals help us calculate time-domain measurements for HRV, whereas Heart Rate is measured as beats per minute (BPM) which was 53 for this duration of measurement.
Why is it important?
HRV is an indicator of Autonomic Nervous System (ANS) activity, and the ANS regulates key body functions such as heart rate, breathing, digestion, blood pressure, and recovery. It has two main branches:
- Parasympathetic nervous system (rest and recovery): Promotes relaxation and recovery, and is associated with higher HRV.
- Sympathetic nervous system (fight or flight): Prepares the body for stress, action, and alertness, and is associated with lower HRV.
How is HRV measured?
The two broad categories of measurement are Time-domain measurements and Frequency-domain measurements. I will exclude the other category, non-linear measurements, for now, and explore it in a separate article. In this article, I’ll share some data around these measurements and shed light on some of my interpretations.
Time-domain measurements
Time-domain measurements are calculated using inter-beat intervals (IBI) by quantifying their variability. Some of the most popular time-domain measurements are:
- RMSSD (Root mean square of successive NN or RR interval differences)
- SDNN or SDRR (Standard deviation of NN or RR intervals)
Time-domain measurements can be based on multiple duration types: ultra short-term (under 5 minutes), short-term (around 5 minutes), and 24 hours. Since I’ll be showing data from wearables, all examples here are based on ultra short-term duration.
- RMSSD: This measurement reflects parasympathetic nervous system activity associated with rest and recovery. This is why it’s one of the most talked-about HRV metrics and can be found in most wearables. RMSSD is measured by taking the root mean square of successive differences between heartbeats, measured in ms. RMSSD is a great indicator of short-term HRV and recovery state, which is why almost all wearables and health apps use this metric to calculate their recovery scores.
- SDNN / SDRR: SDNN and SDRR measure the overall variability of inter-beat intervals and reflect both sympathetic (stress, fight or flight) and parasympathetic (rest) inputs. SDNN is measured in the same manner except SDNN includes all sinus beats while SDRR excludes them and only includes the normal beats. The measurement is calculated by taking the standard deviation of the inter-beat intervals (IBIs).
Before I show some calculations with real data, I’ll add one more time-domain metric:
- pNN50: This is a marker of parasympathetic activity that shows how often the heart makes a big jump in timing between beats. It’s measured as a percentage of successive intervals with a difference over 50 ms. Usually, when the body is well-rested, pNN50 is higher.
How to calculate time-domain measurements
For the calculations, let’s start with the following ECG data taken by an Apple Watch, with the inter-beat intervals interpreted by the ECG+ app. It’s not too difficult to calculate them, since Apple uses a standard ECG grid - which means 1 small box is equivalent to 40 ms and 1 big box is equivalent to 5 small boxes or 200 ms.
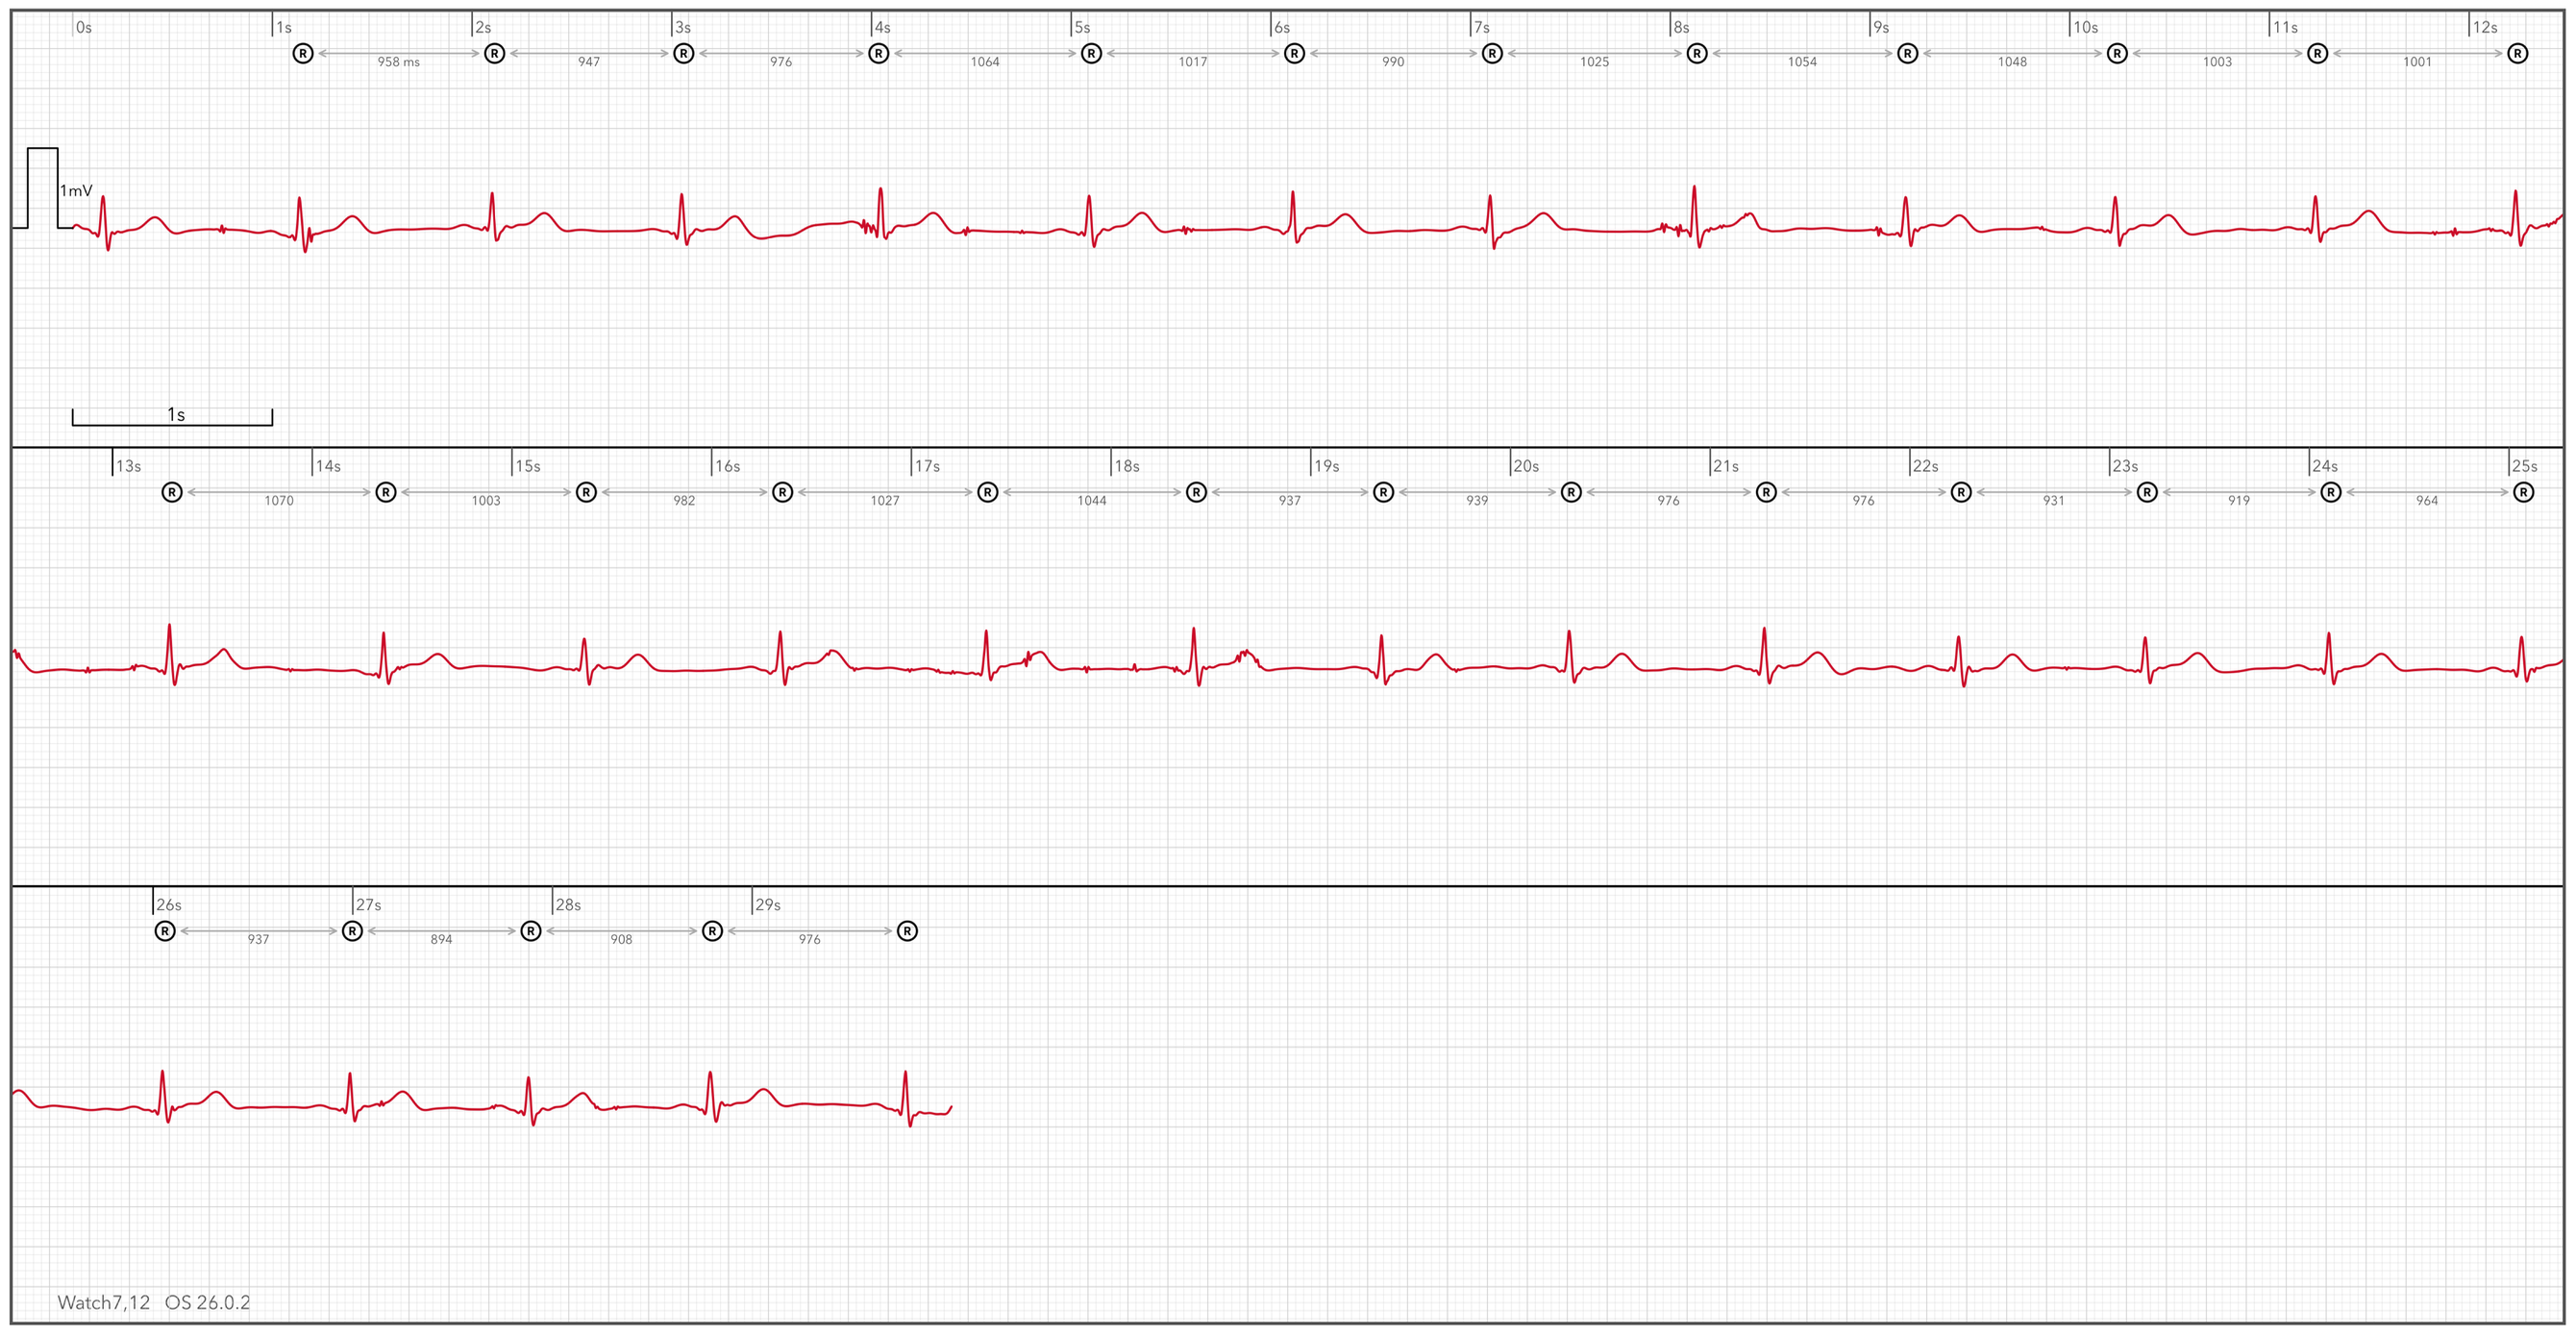
The inter-beat intervals (IBI) from the ECG above are (measured in ms):
958, 947, 976, 1064, 1017, 990, 1025, 1054, 1054, 1048, 1003, 1001, 1070, 1003, 982, 1027, 1044, 937, 939, 976, 976, 931, 919, 964, 937, 894, 908, 976.
Since there are 28 intervals, there are 28 - 1 = 27 differences.
RMSSD is calculated as the root mean square of these differences:
\[\text{RMSSD} = \sqrt{ \frac{1}{27} \sum_{i=1}^{27} \left( RR_{i+1} - RR_i \right)^2 }\] \[\text{RMSSD} = \sqrt{ \frac{(947-958)^2 + (976-947)^2 + (1064-976)^2 + \cdots + (976-908)^2}{27} }\]So, RMSSD for this data is roughly 44.8 ms.
Assuming there are no false beats, SDNN or SDRR is calculated as follows.
First, we compute the mean RR:
\[\overline{RR} = \frac{1}{28} \sum_{i=1}^{28} RR_i = \frac{27620}{28} \approx 986.43 \text{ ms}\]Then we compute SDNN / SDRR:
\[\text{SDNN / SDRR} = \sqrt{ \frac{1}{N-1} \sum_{i=1}^{N} \left( RR_i - \overline{RR} \right)^2 }\] \[\text{SDNN / SDRR} = \sqrt{ \frac{(958-986.43)^2 + (947-986.43)^2 + (976-986.43)^2 + \cdots + (976-986.43)^2}{27} }\]This value comes out to approximately 49.76 ms. I used 27 (N - 1) as the denominator since that’s the definition of sample standard deviation; for population standard deviation, N (28, in this case) would be used instead.
For pNN50, we start with all 27 intervals, of which only 5 (in bold) exceed 50 ms:
958, 947, 976, 1064, 1017, 990, 1025, 1054, 1054, 1048, 1001, 1070, 1003, 982, 1027, 1044, 937, 939, 976, 976, 931, 919, 964, 937, 894, 908, 976.
So pNN50 is the percentage of intervals exceeding 50 ms: 5/27 = 0.185, or 18.5%.
Frequency-domain measurements
Just like time-domain measurements, there are a few frequency-domain measurements. Some of the ones I’ve encountered are:
- LF power: Absolute or relative power of the low-frequency band (0.04-0.15 Hz). LF power indicates slower heart-rate changes and reflects a mix of both parasympathetic and sympathetic activity.
- HF power: Absolute or relative power of the high-frequency band (0.15-0.4 Hz). HF power indicates fast heart-rate changes driven by parasympathetic activity.
- LF/HF: Ratio of LF and HF power. A low ratio indicates parasympathetic dominance (rest and recovery), and a high ratio indicates sympathetic dominance (fight or flight). Although there are many researchers that challenge this interpretation around LF/HF ratio.
Some data about frequency-domain measurements
Calculating frequency-domain measurements from this data requires converting these inter-beat intervals into a Power Spectral Density (PSD) plot. A PSD is a graph that shows how heartbeat variability is distributed across frequencies, helping us see whether the heart is being guided more by relaxation (parasympathetic) or stress (sympathetic) at that moment.
I’ll share some frequency-domain data I collected using software called Kubios HRV (kubios.com/hrv-app), paired with a Polar OH1 heart rate monitor.
As you can see below, on the day when the body was not recovered properly, HRV was lower, with a 32 ms RMSSD accompanied by an LF/HF ratio of 1.1. This signifies more sympathetic dominance. On the other hand, on the day when the body was well-rested, HRV was higher, with a 79 ms RMSSD and an LF/HF ratio of 0.48. This signifies parasympathetic dominance.
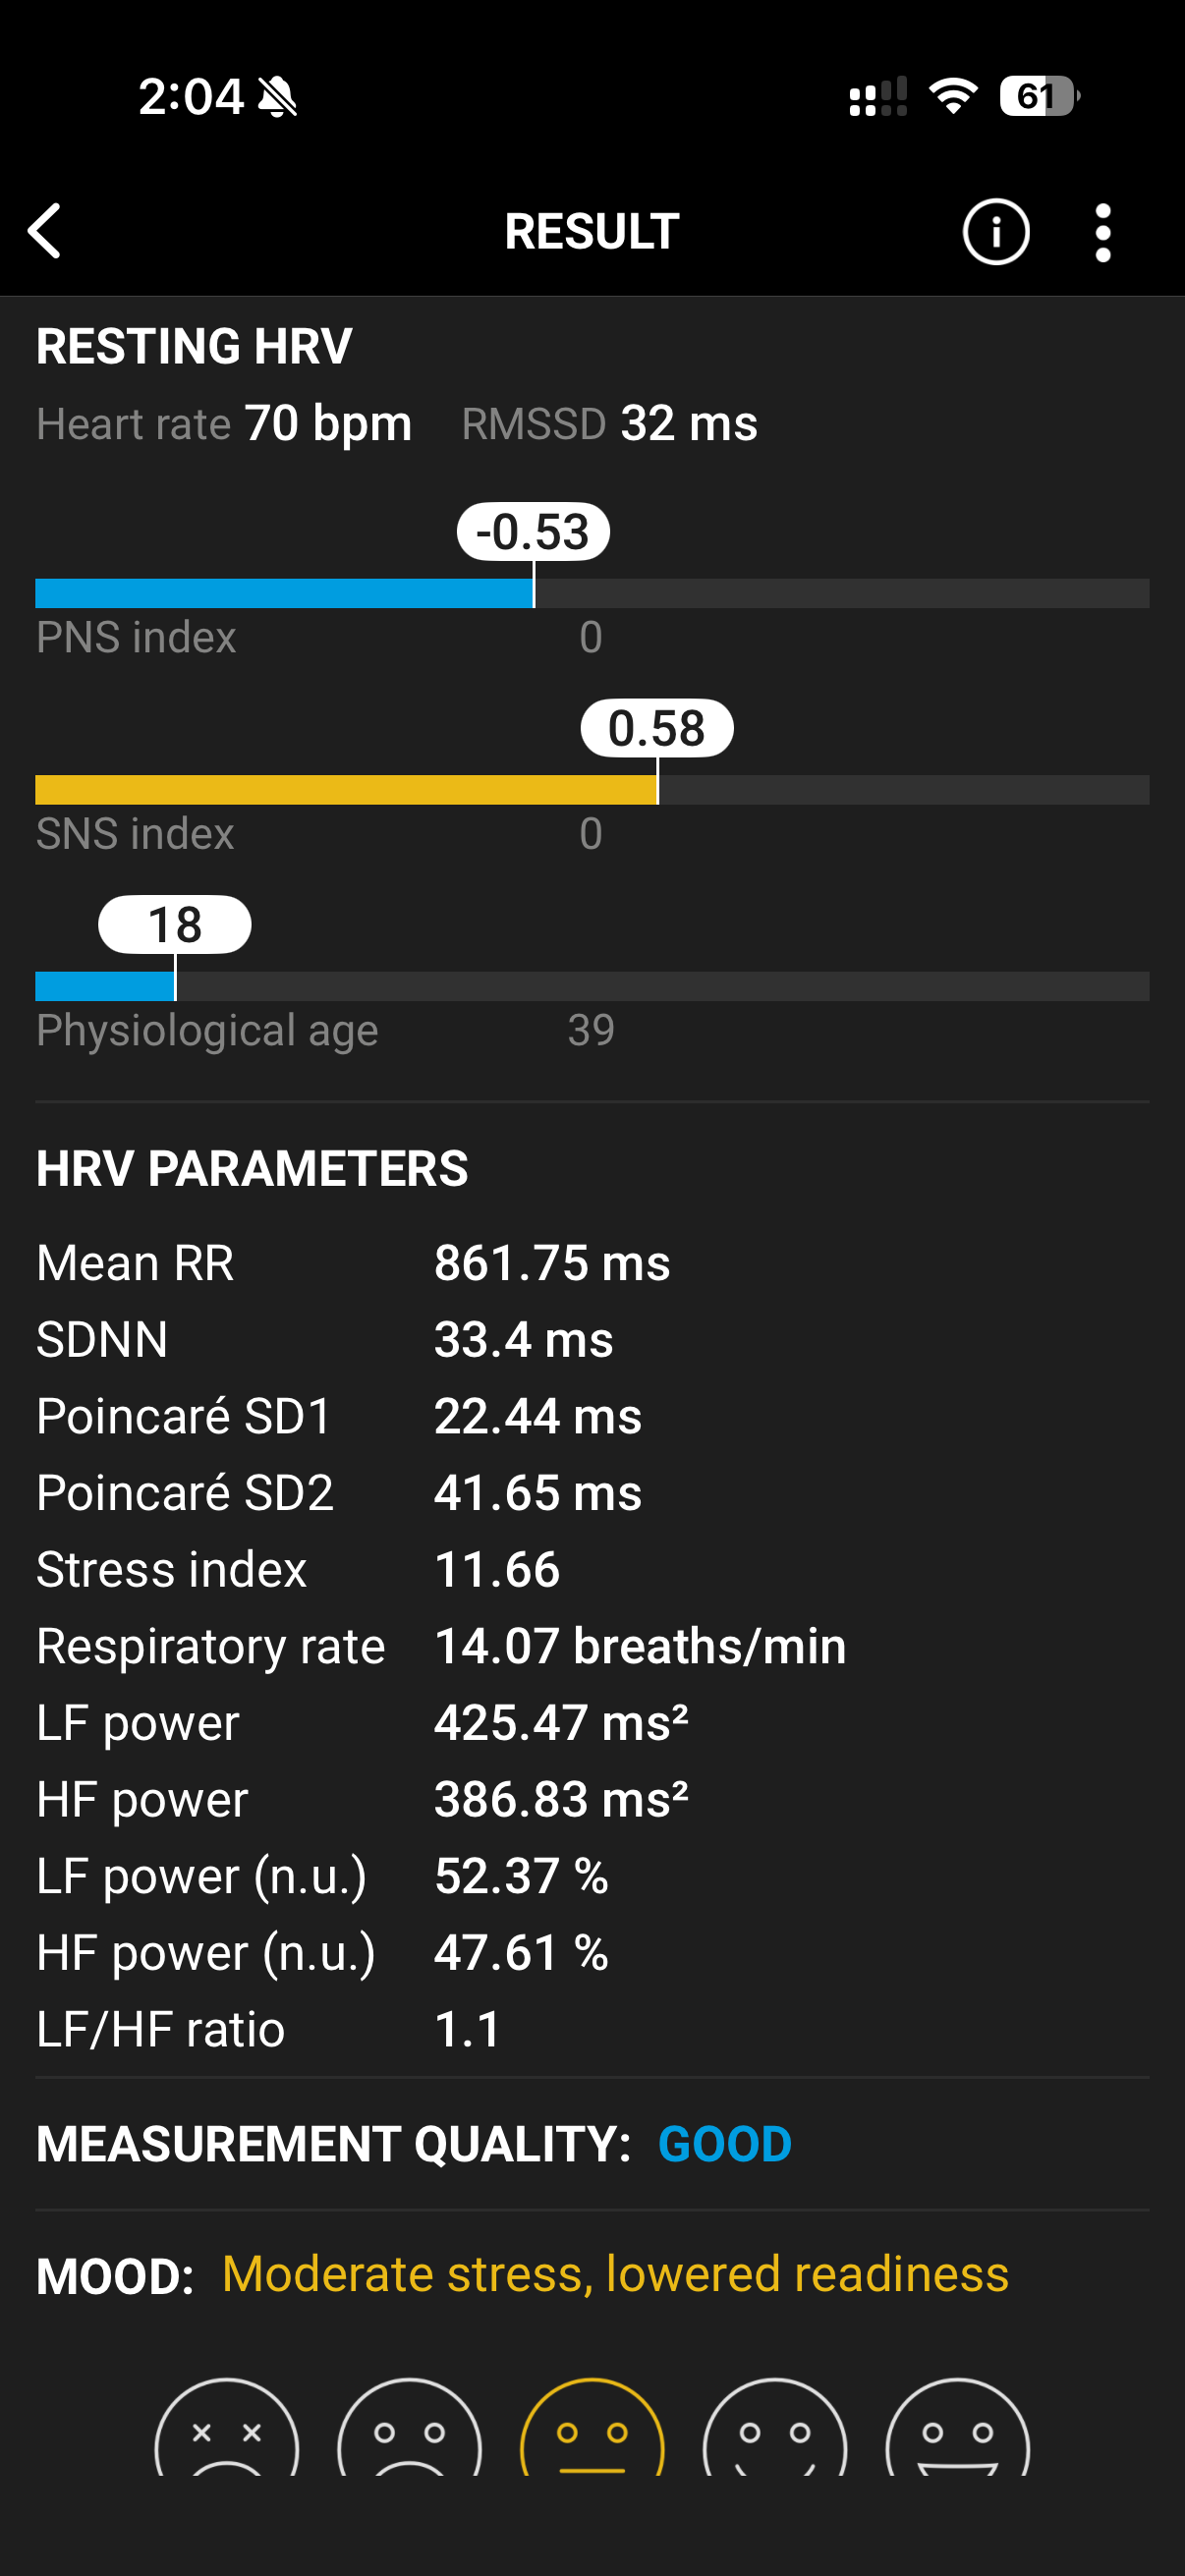
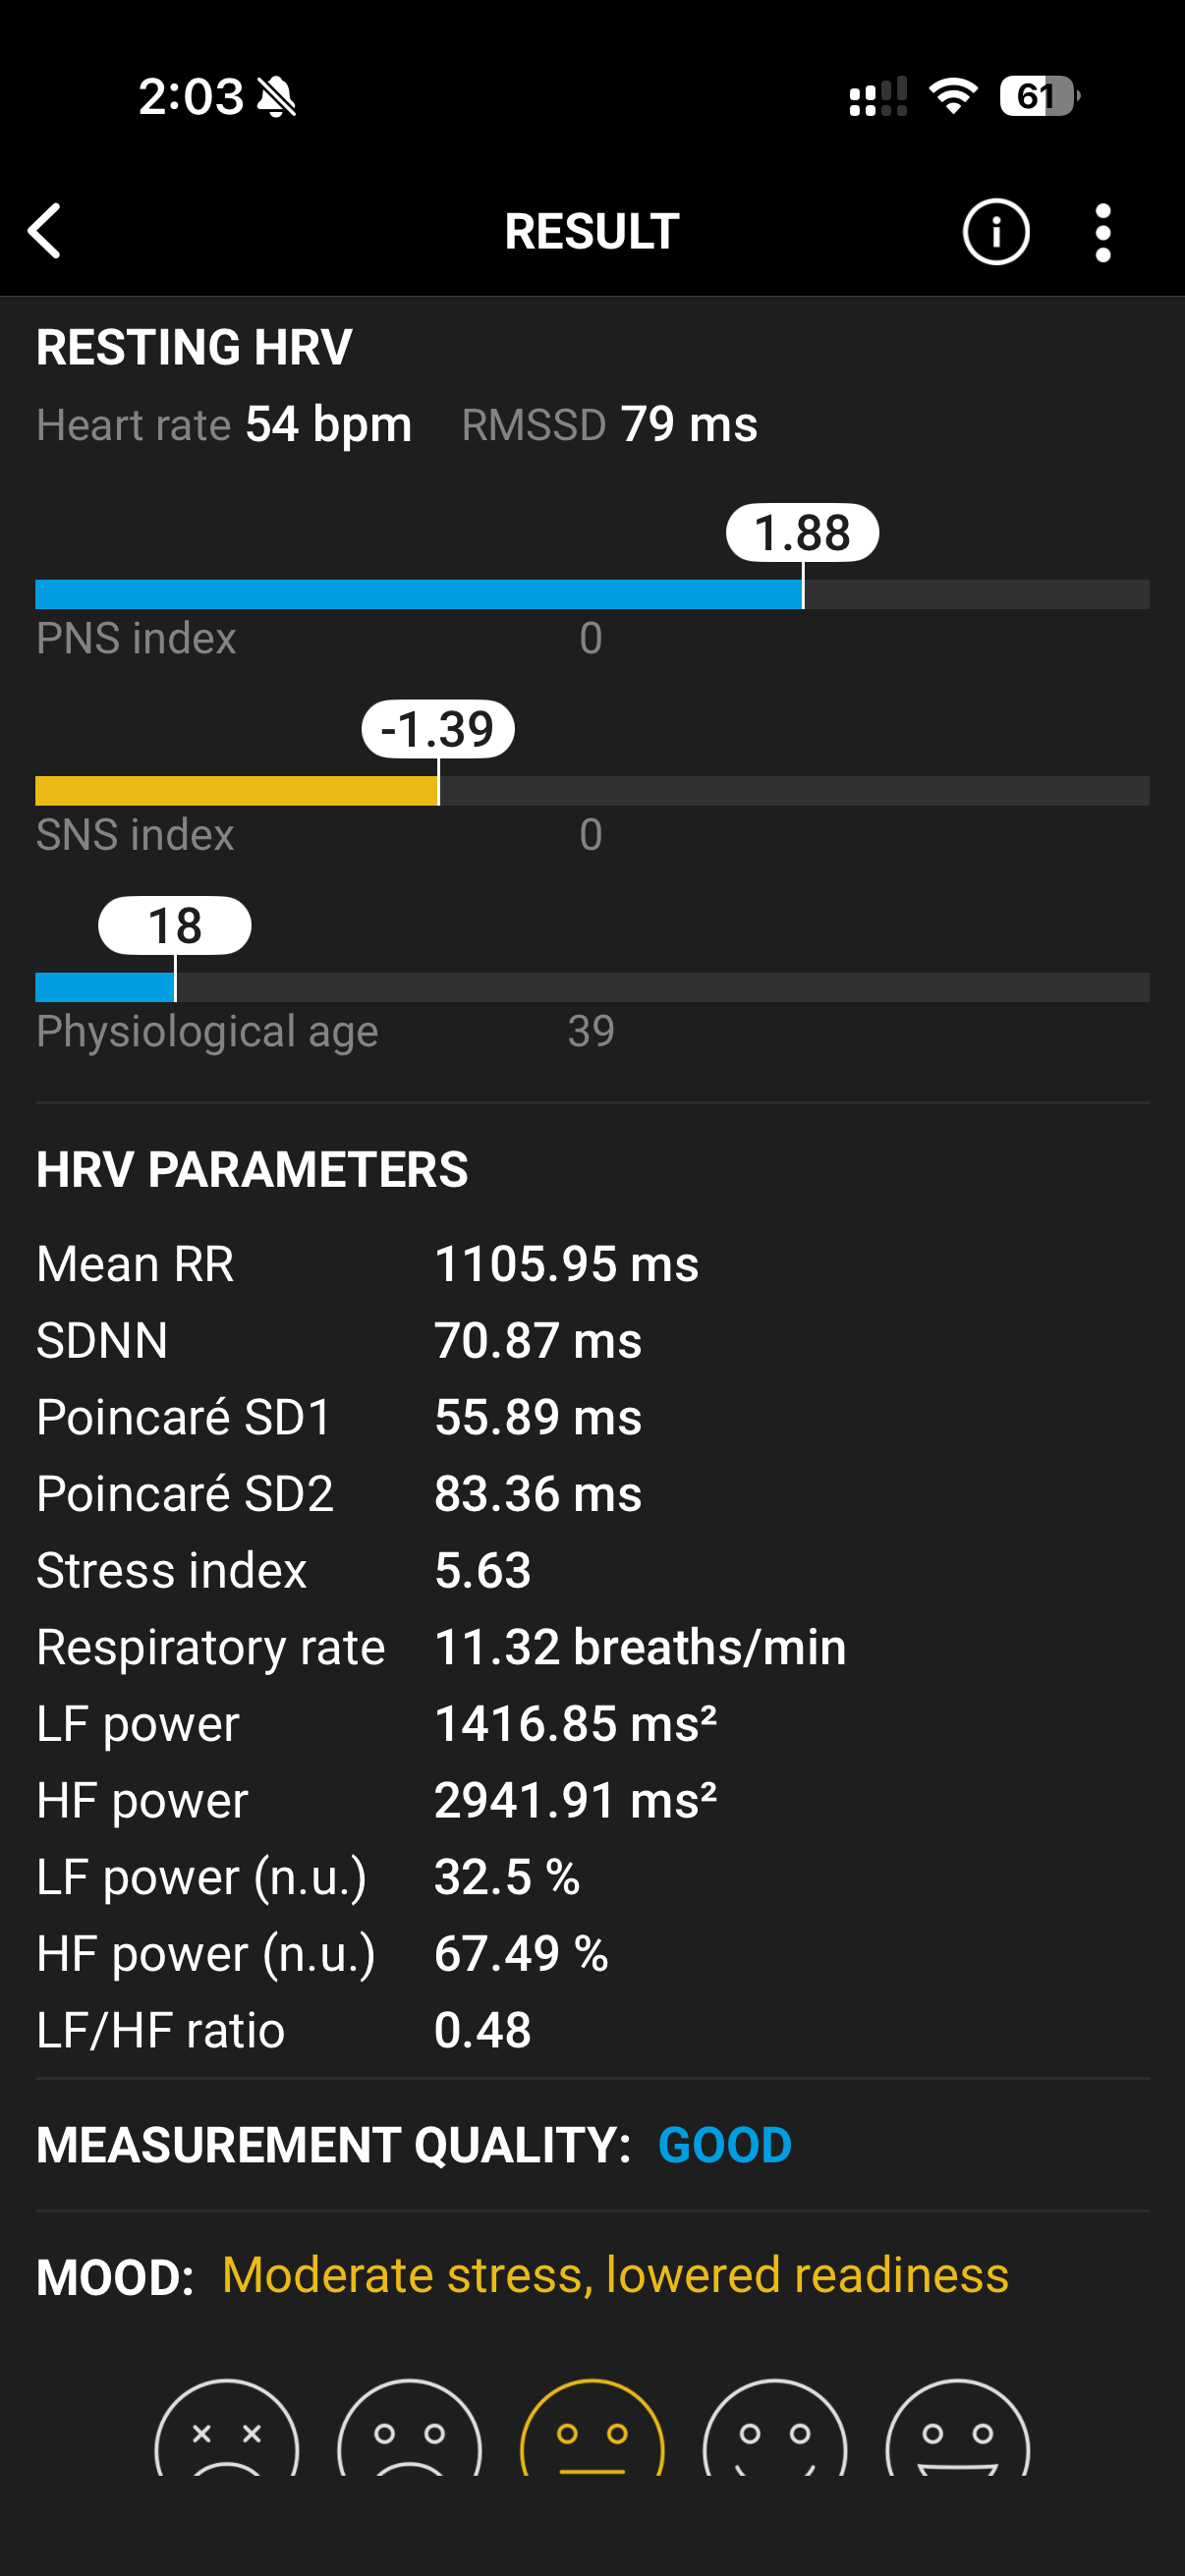
Both measurements were taken using the Kubios HRV iOS app paired with a Polar OH1 heart rate sensor.
I’ll end this article here and will cover more details, along with more data, in the next ones. I hope you liked this article and learned something new.
If you want more details about heart rate variability and all these metrics, feel free to check out this great paper I read a while ago and used as a reference:
Shaffer F, Ginsberg JP. An Overview of Heart Rate Variability Metrics and Norms. Front Public Health. 2017 Sep 28;5:258. doi: 10.3389/fpubh.2017.00258. PMID: 29034226; PMCID: PMC5624990.